Set up workspace and resource level alerts for critical data issues.
Available Plans
starter
growth
enterprise
11 minute read
RudderStack’s smart alerting capabilities let you set up notifications for critical data issues so you can take appropriate actions immediately before they escalate into major problems.
Overview
With RudderStack’s alerting feature, you can configure alerts for:
Event Stream latency
Event delivery failures
Pre-sync or sync failures
Event volume drops
Transformation failures
Tracking Plan violations
Partial row failures and fatal syncs (for Reverse ETL connections)
Profiles run failures
You can also use the alerting feature to:
Set up alert delivery channels of your choice like email, custom webhook, Slack, or any other tool. Once the alert threshold is hit, RudderStack automatically delivers alerts to these systems.
Set failure thresholds at the workspace and resource level, so you are alerted only when necessary.
Tracking Plan violations for a particular source, that is, the incoming source events and properties do not comply with the Tracking Plan connected to that source.
P95 latency alerts are available only in the Enterprise plan.
RudderStack triggers the P95 latency alert if the maximum latency experienced by 95% of the events to reach the destination exceeds the specified threshold.
For example, if you send 100 events to an Event Stream destination and the P95 latency alert threshold is set to 15 minutes, then 95 of those events should be delivered in strictly less than the specified threshold (that is, 15 minutes). Otherwise, RudderStack triggers an alert.
Important considerations
The P95 latency metric and alerts are applicable only for Event Stream destinations connected to sources in cloud mode. They are not applicable for:
Event Stream destinations connected to sources in device mode
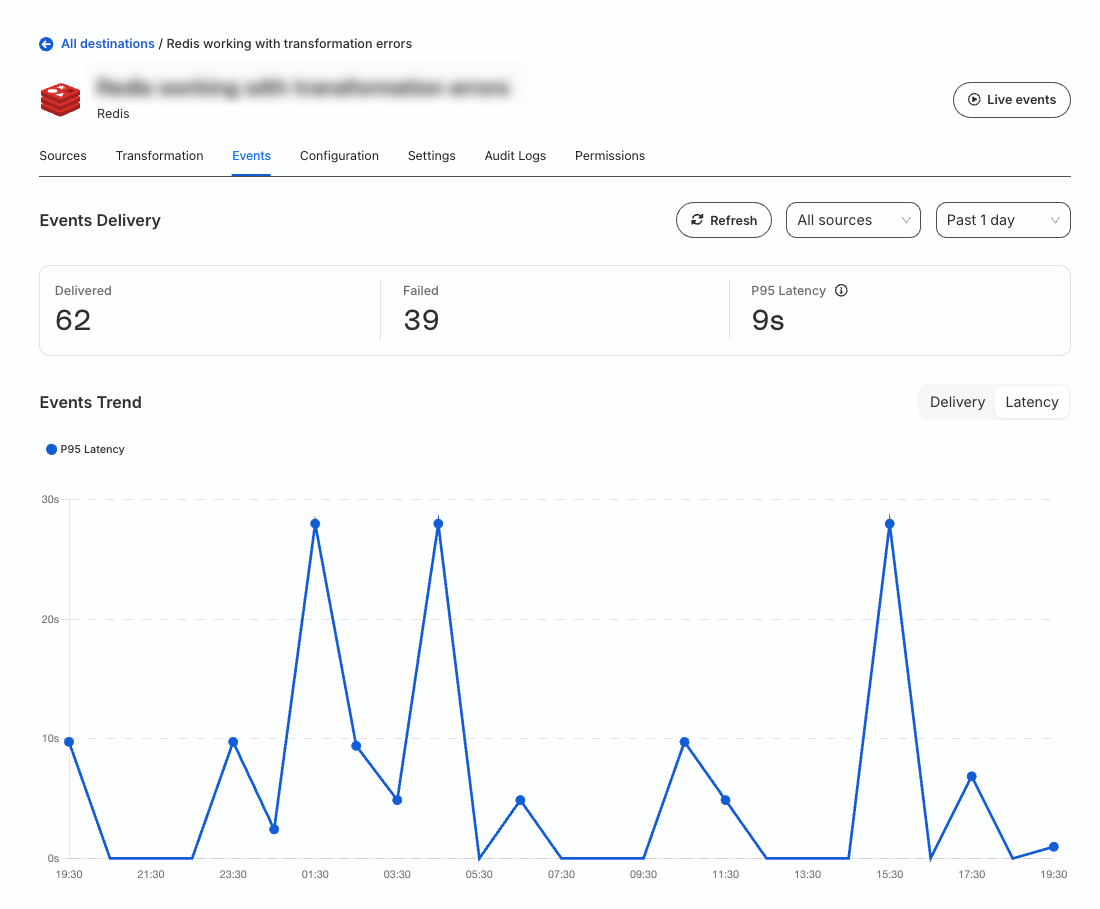
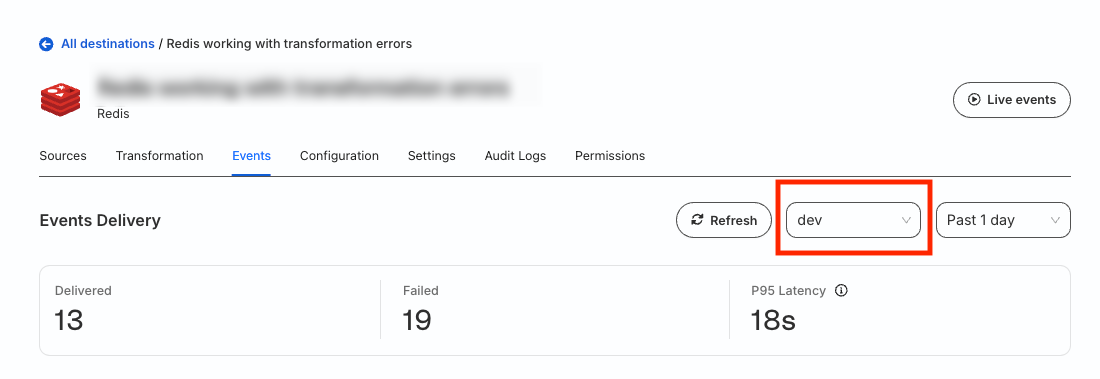
Go to the Events tab of your Event Stream destination and click the Latency tab to check the average P95 latency across all Event Stream sources.
To view the P95 latency for events coming from a particular source, filter the Event Stream source from the dropdown:
Low event volume alerts
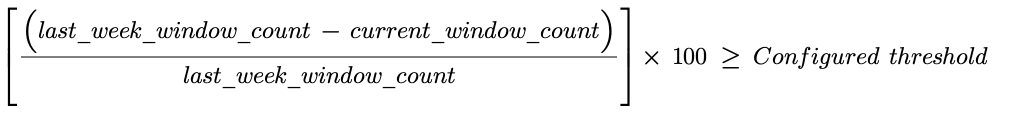
RudderStack triggers the Low event volume alert if the event volume drop for an Event Stream source in the last one hour exceeds the configured threshold compared to the event volume for the same time period in the last week.
The Low event volume alert is triggered based on the below formula:
For example, you will get an alert if:
An Event Stream source ingests 450 events within the last hour (for example, 11 a.m. to 12 p.m.), but it ingested 1000 events from 11 a.m. to 12 p.m. a week before.
The alert threshold was set to 50%.
In this case, RudderStack triggers an alert as the volume drop percentage (55%) exceeds the configured threshold (50%).
Note that:
A 0% threshold indicates that RudderStack triggers an alert even if the number of ingested events in the past one hour is the same as last week. That is, last_week_window_count = current_window_count.
A 100% threshold indicates that RudderStack triggers an alert if the source ingested no events in the last one hour but some events (>0) exactly a week before. That is, current_window_count = 0 and last_week_window_count > 0.
Transformation failure alerts
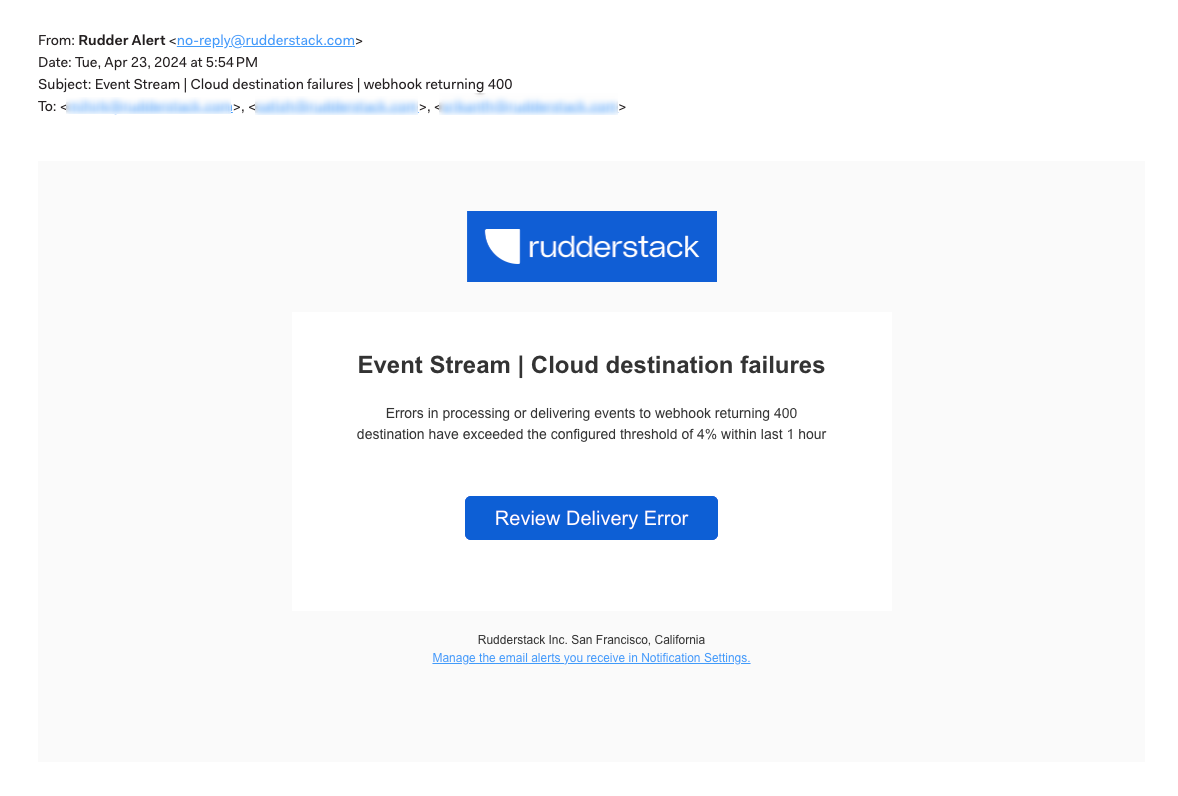
RudderStack triggers the Transformation failures alert if the transformation failures in the last one hour exceed the configured threshold.
For example, you will get an alert if:
You set the alert threshold to 10%.
The transformation ingests 100 events in the past one hour.
11 events are dropped due to a transformation error, that is, failure to transform the event correctly as per the specified logic.
Reverse ETL
In this section, you can configure alerts for the following incidents applicable to all your Reverse ETL sources:
Failure type
Description
Partial row failures
Failures in syncing records from the warehouse source to the connected destination.
Sync row failures Beta
Failures in syncing rows from the warehouse source to the connected destination, scoped at an individual sync level.
Fatal syncs
Fatal errors causing a running sync to be aborted. Possible reasons include:
Incorrect warehouse connection credentials
Warehouse settings changed/updated midway through the syncs
Source/destination downtime or network error
Partial row failures vs. Sync row failures
This section details the differences between Partial row failures and Sync row failures.
Partial row failures
Partial row failures trigger an alert when the number of failed rows exceeds the configured threshold for a particular connection within a rolling 1 hour time window, irrespective of the number of syncs completed within that time.
RudderStack evaluates this alert while a sync is still running, so you get feedback without waiting for the sync to finish. Sync row failures, by contrast, are evaluated only after each sync completes.
Sync row failures
Sync row failures trigger an alert when the number of failed rows exceeds the configured threshold. RudderStack evaluates the failure count and triggers alerts at the end of each sync.
Partial row failures to monitor overall connection health and
get quick feedback on any failures
Sync row failures to monitor the health of a particular sync and get fewer alerts
Both alert types follow the same 24-hour alert delivery limit as your other alerts — at most one notification per resource per alert type per channel in any 24-hour period.
Profiles
In this section, you can configure alerts for the following incidents applicable to your Profiles runs:
Failure type
Description
Run failures
Failures encountered while running your Profiles project.
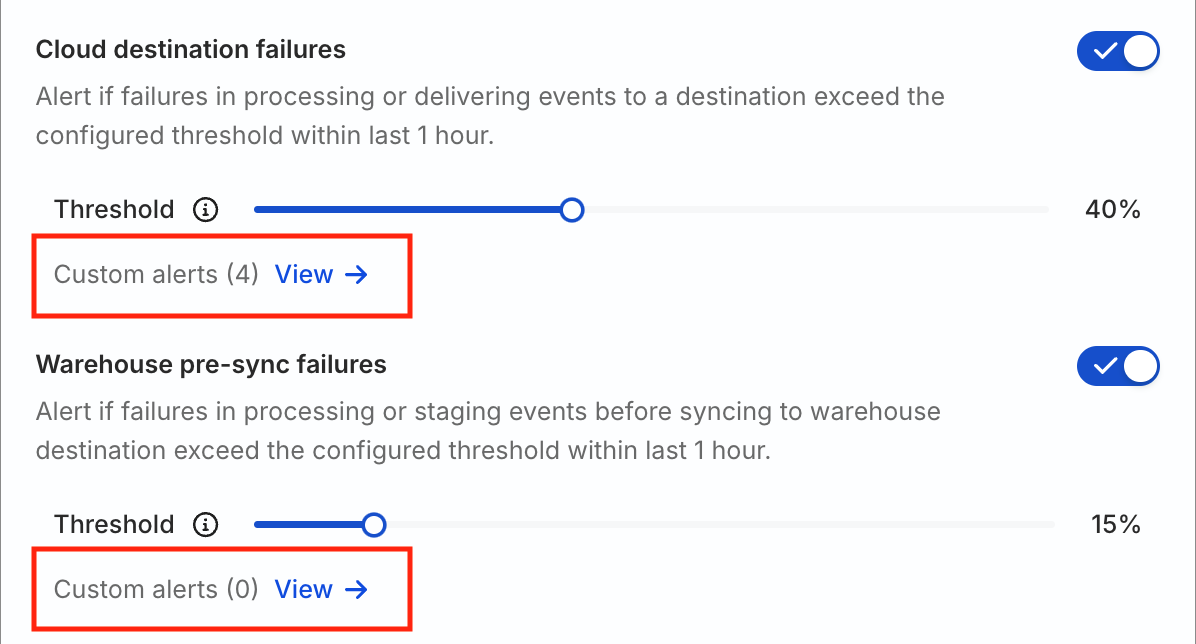
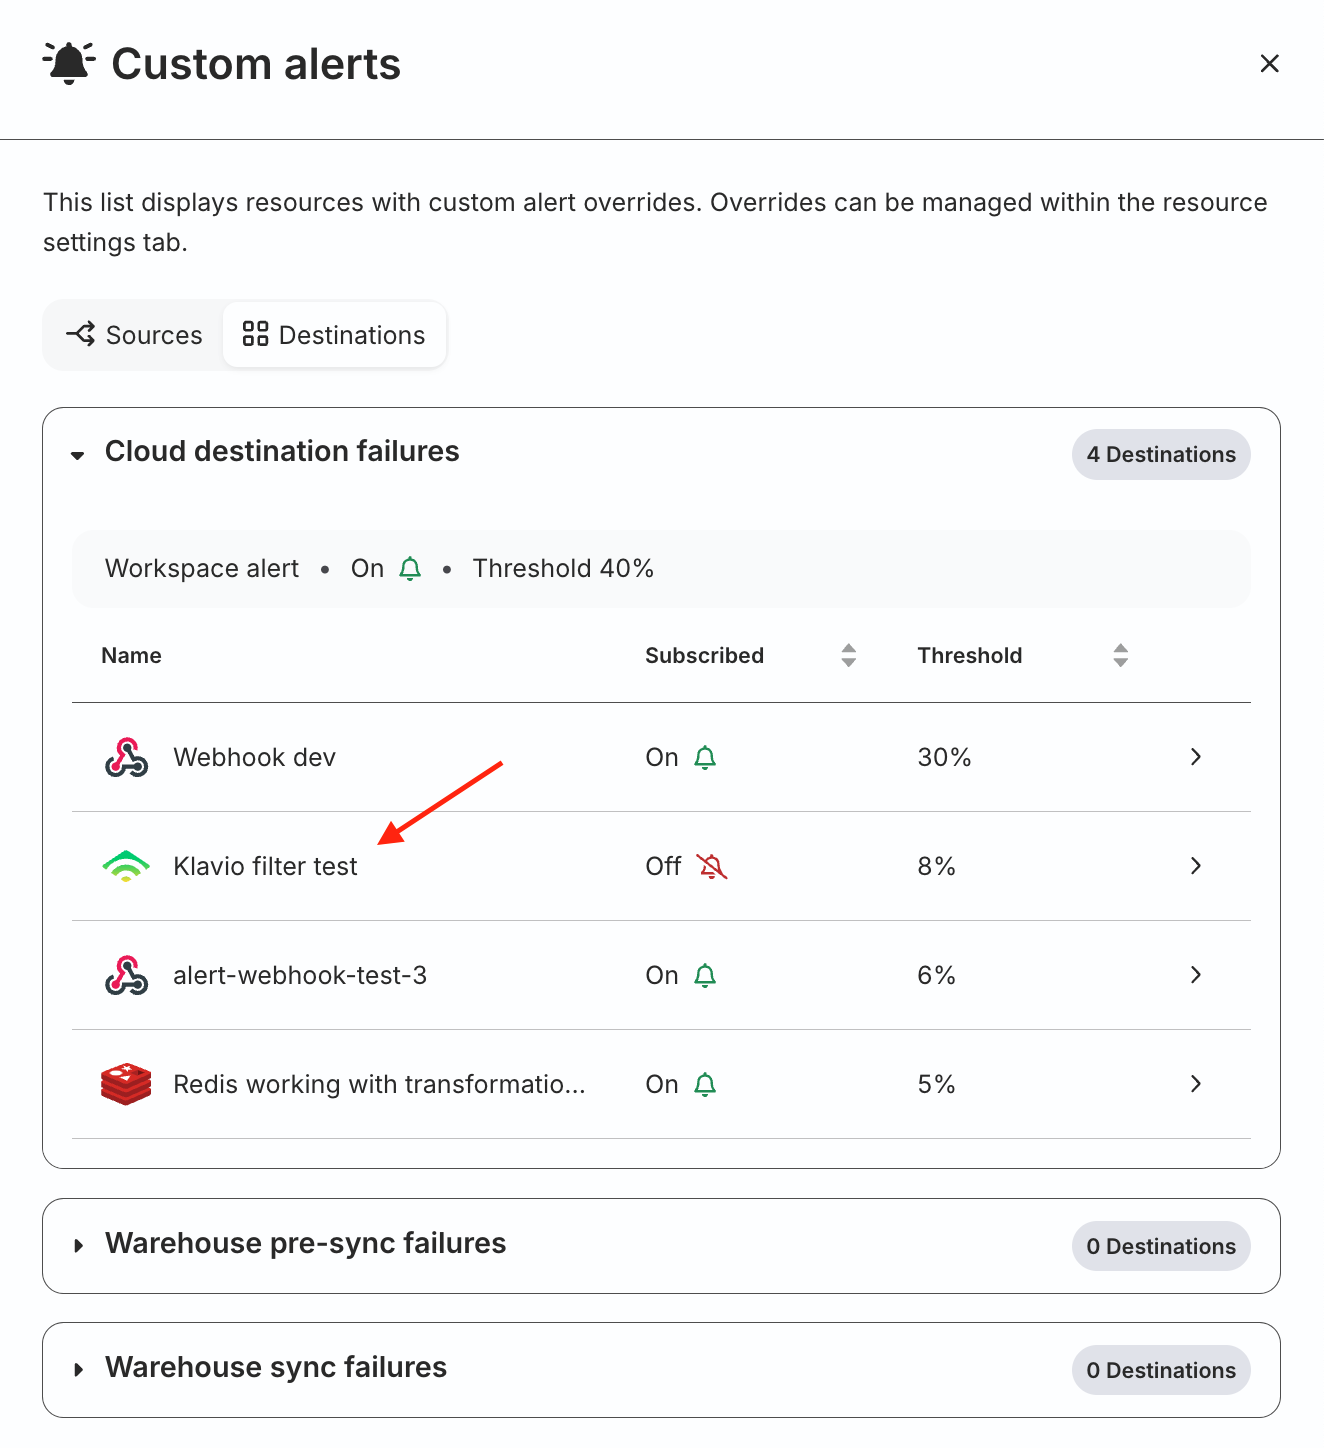
Custom alerts
Click the Custom alerts setting present below each failure type to view the resources for which custom alert overrides are configured:
The resulting sidebar lists all the resources with custom alerts categorized by failure type. You also see the following information:
Name: The resource name.
Subscribed: Whether alerts are on or off for that failure type.
Threshold: Custom alert threshold value set for that resource.
Click on a resource to change these settings.
Resource level alerts
Note that:
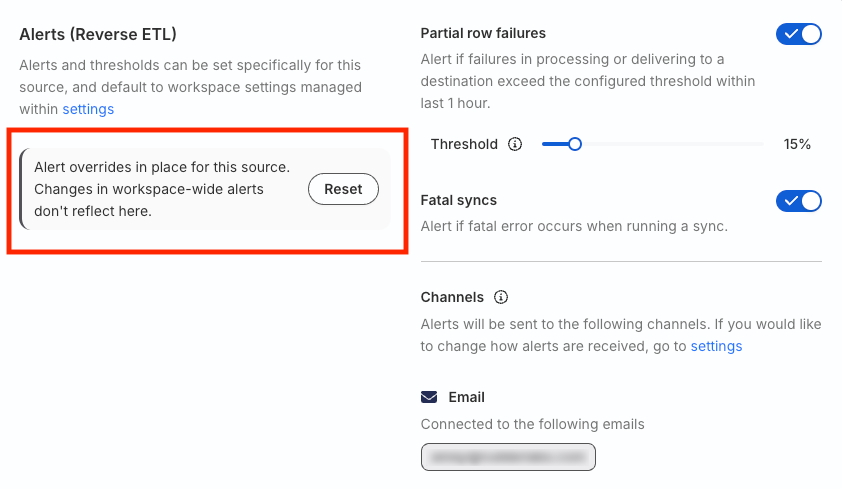
Once you set the alert overrides for a particular resource, any changes to the workspace-level settings will not be applicable for that resource.
You cannot change the alert delivery channels for a particular resource.
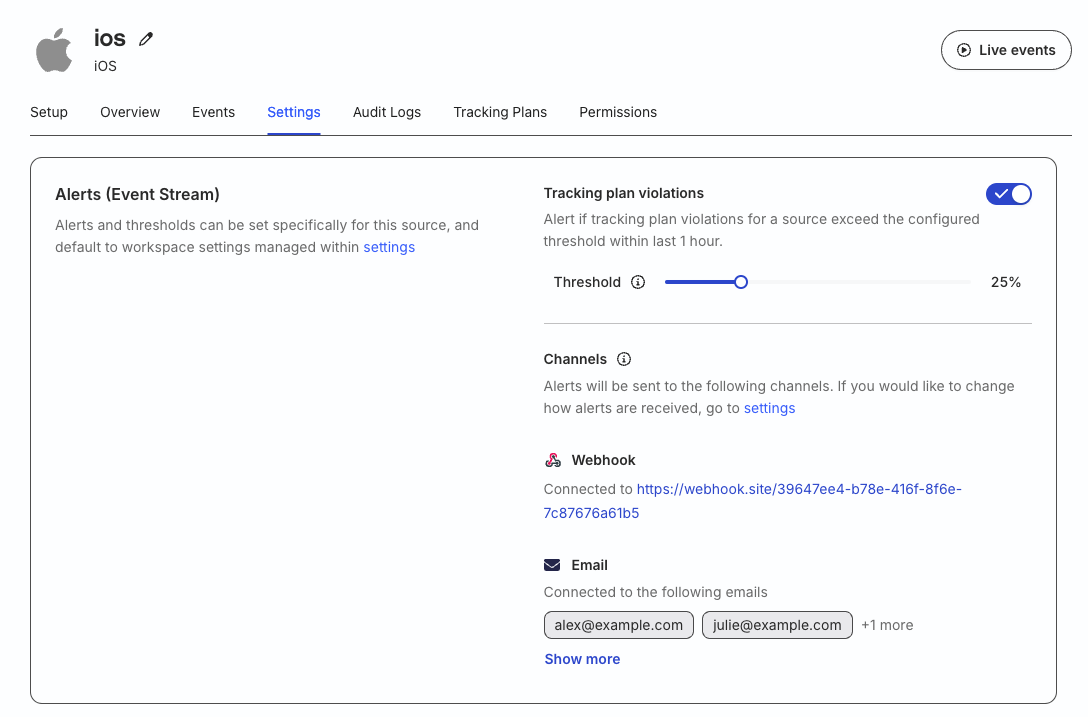
Go to the resource (source or destination) for which you want to customize the alert settings. Then, click the Settings tab and scroll down to the alerts section.
If configured, you will see the workspace-level alert settings and thresholds enabled for the resource by default. You can change these settings and set custom thresholds for this resource.
Once you change the settings, you will automatically see the following message pop up:
Resource-specific alert types
The following table lists the alert types applicable to a particular resource:
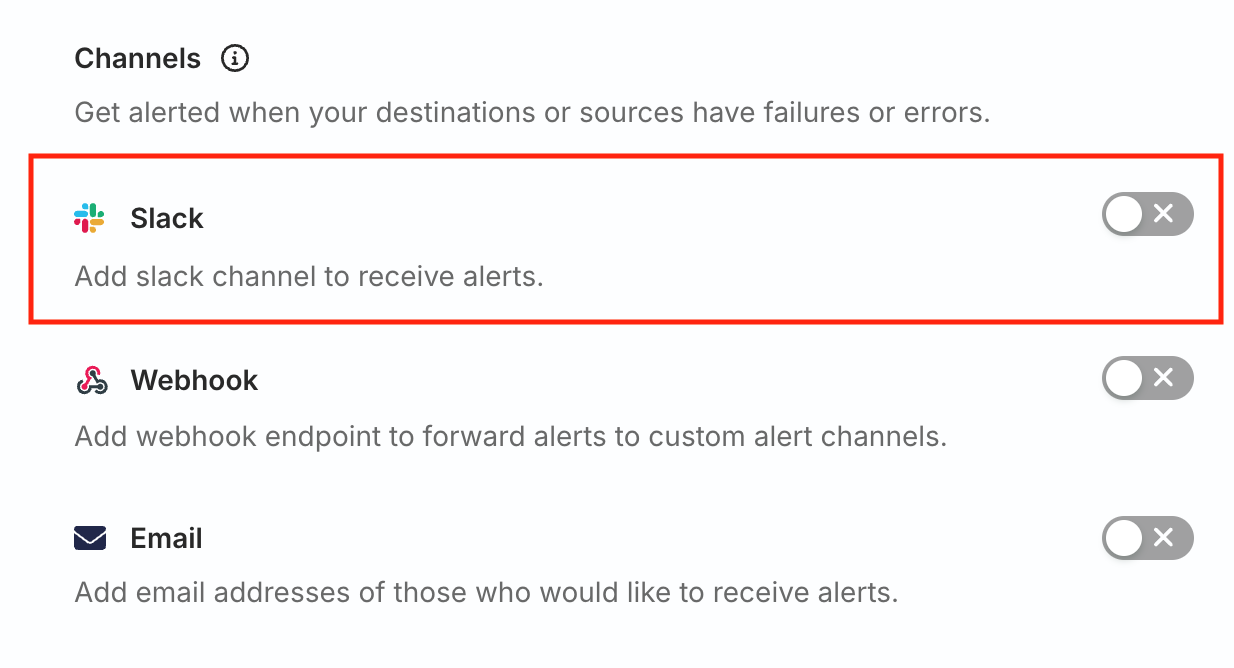
You can set up dedicated alert channels to get notified whenever your sources or destinations have failures or errors. This allows you to take proactive measures to fix the problems before they escalate into major issues.
Note that:
You can set up separate alert delivery channels for your Event Stream and Reverse ETL pipelines.
Toggling off alerts for a channel automatically removes all the configurations. You will have to reconfigure the channel to use it again.
RudderStack limits the alert delivery to one alert per resource per alert type for each configured channel every 24 hours.
RudderStack provides the following options to set up channels for delivery alerts:
Slack
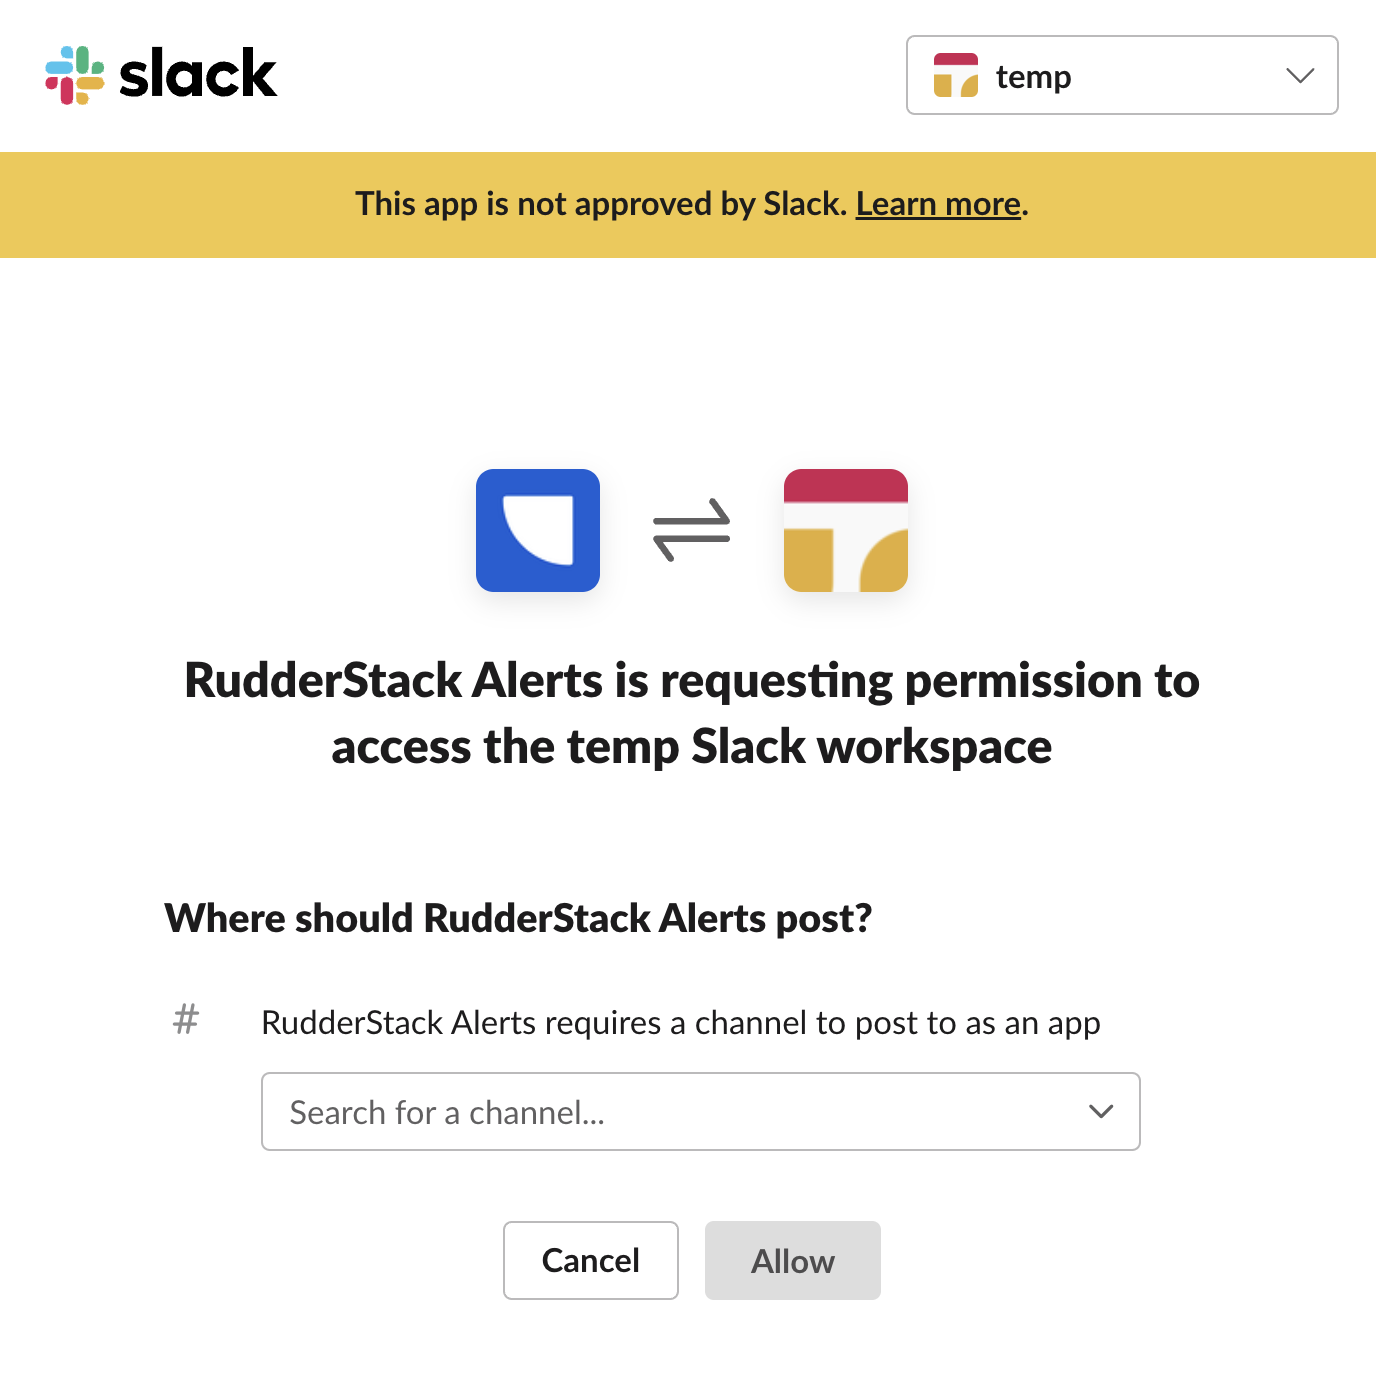
Toggle on the Slack setting to receive alerts on your preferred Slack channel.
Set the Slack channel and authorize RudderStack to post the alerts by clicking Allow. Note that you should be an admin of the Slack workspace to grant RudderStack the necessary permissions to post to that channel.
While setting the Slack channel, you will see a This app is not approved by Slack ribbon at the top. This is because Slack has not reviewed the app yet. However, it is completely safe to install.
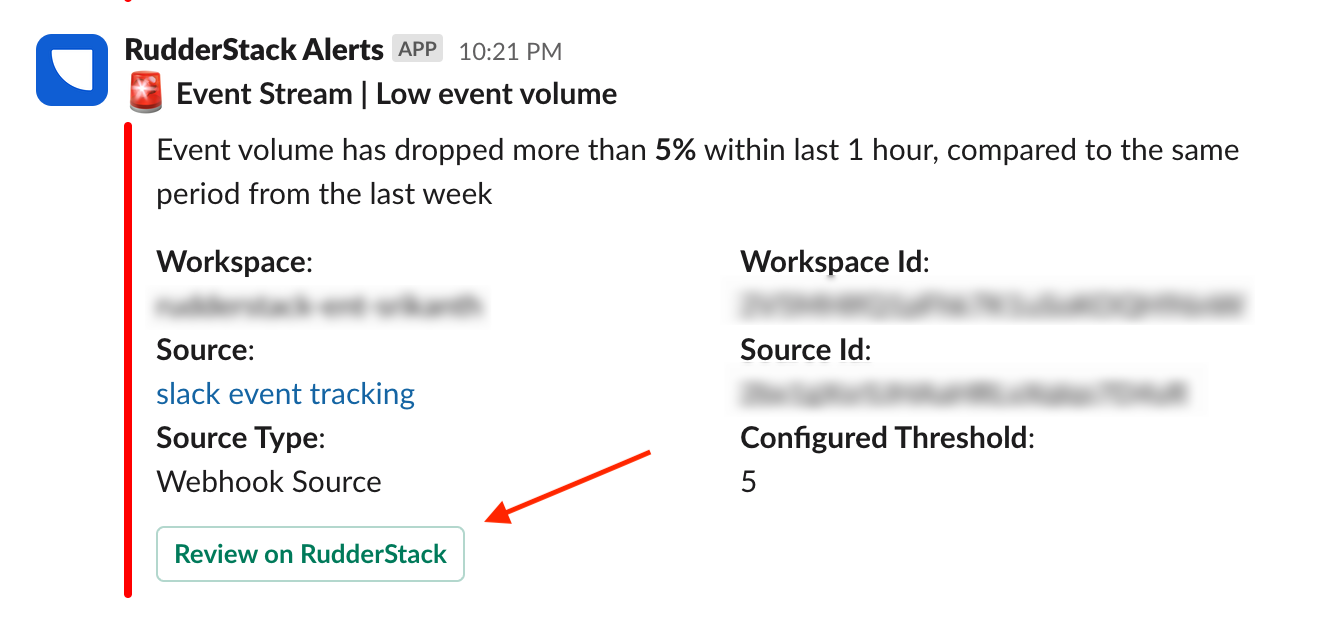
Once the alert is triggered, RudderStack automatically sends a notification on the specified Slack channel. Click Review on RudderStack to go to the specific resource (source or destination) to investigate and fix the errors.
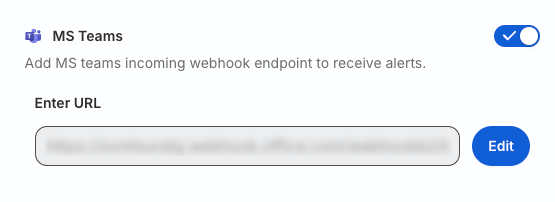
Microsoft Teams
To use MS Teams for alerts delivery, you must create an incoming webhook for the Teams channel you wish to use.
Toggle on the MS Teams setting and enter the incoming webhook URL to receive alerts on your preferred Teams channel.
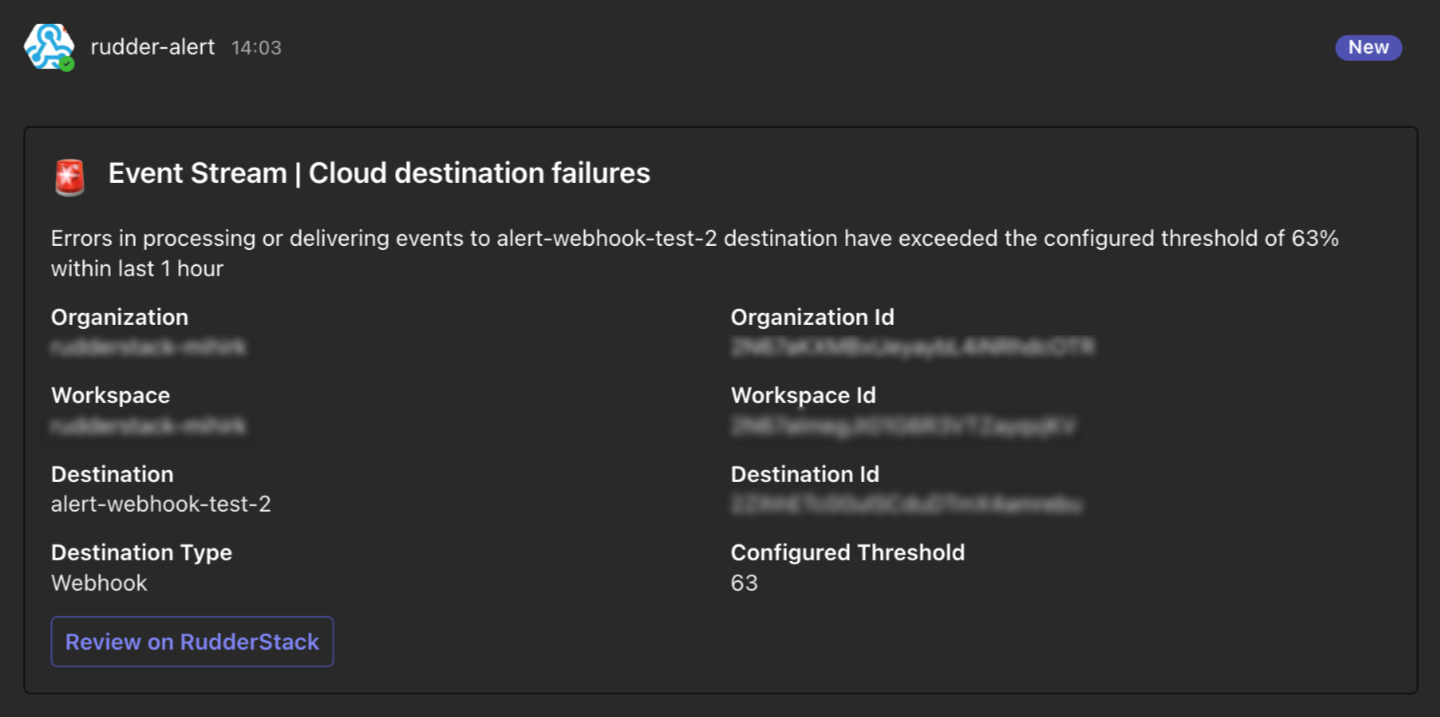
Once the alert is triggered, RudderStack automatically sends a notification on the specified Teams channel:
Click Review on RudderStack to go to the specific resource (source or destination) to investigate and fix the errors.
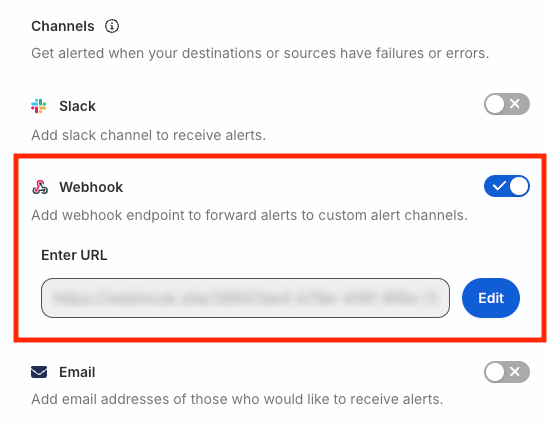
Webhook
Toggle on the Webhook setting to forward the alerts to custom webhook channels.
RudderStack sends the alerts as a POST request to the configured endpoint while following the Prometheus styling format.
Prometheus is a widely accepted monitoring and alerting tool. Its alert format is compatible with various other monitoring and incident management tools like Squadcast, PagerDuty, etc.
A sample webhook response is shown:
{"alerts":[{"endsAt":"0001-01-01T00:00:00Z","labels":{"severity":"critical","alertname":"partial-row-failures","workspace":"<workspace_name>","destination":"Failing Webhook","workspaceId":"<workspace_id>","organization":"<org_name>","destinationId":"<destination_id>","organizationId":"<org_id>","configuredThreshold":61},"status":"firing","startsAt":"2024-02-05T00:02:49.933Z","annotations":{"description":"Errors in processing or delivering events to Failing Webhook destination have exceeded the configured threshold of 61% within last 1 hour"},"fingerPrint":"d9885cc7f11b8db0"}],"status":"firing"}
Send alerts to downstream tools
You can also leverage webhooks to forward the alerts to any RudderStack-supported downstream tool:
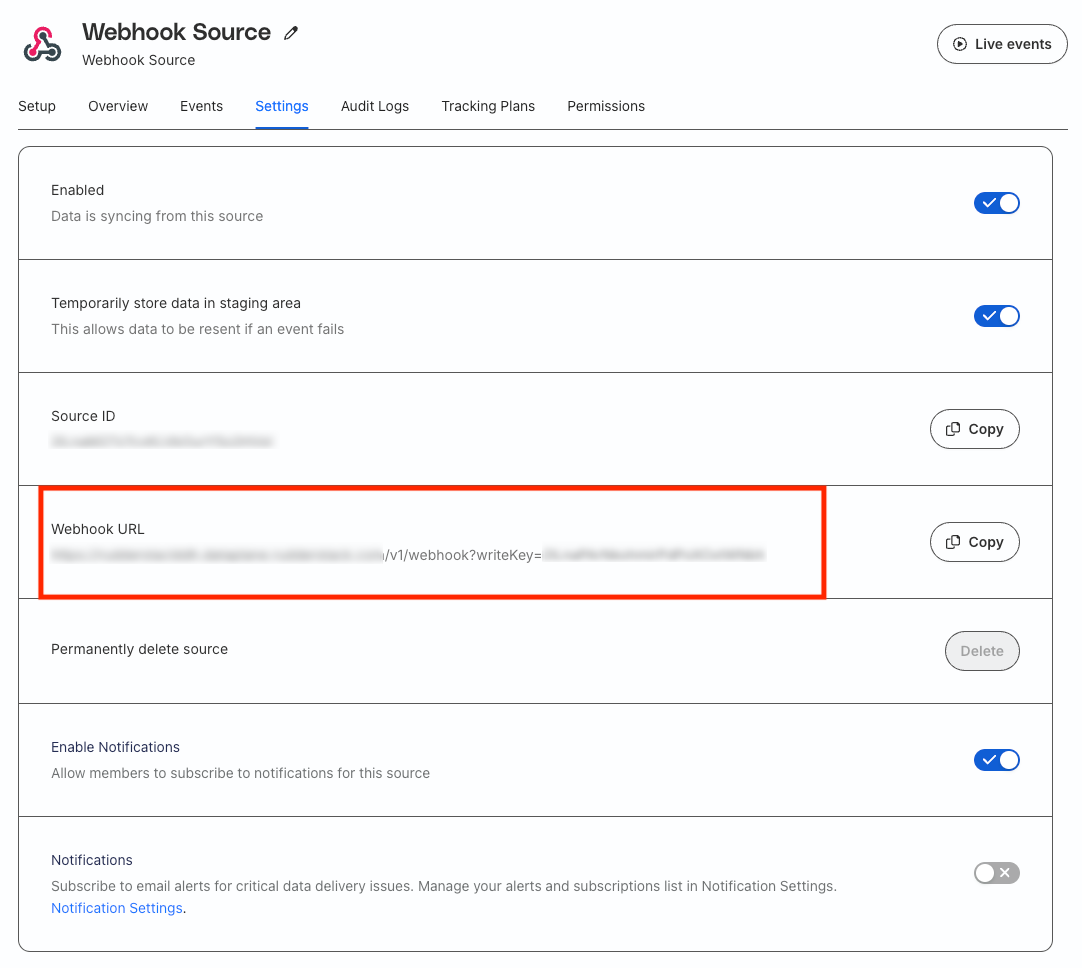
Set up a webhook source. Note the webhook URL containing the source write key parameter.
Once you set up the connection, specify the webhook source URL obtained in Step 1 in the Enter URL field where RudderStack forwards the alerts.
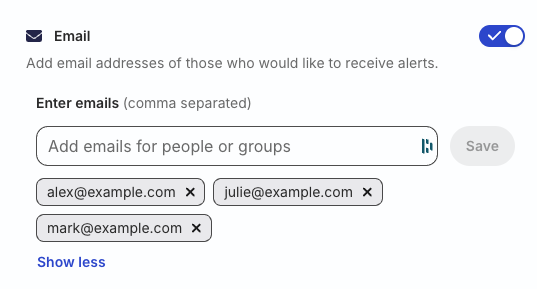
Email
Toggle on the Email setting and specify comma-separated email addresses of the users who would like to receive the alerts.
Once the alert is triggered, these users will automatically get email alerts to investigate and fix the errors.
Alert frequency
RudderStack limits the alert delivery to one alert per resource (source or destination) per alert type for each configured channel every 24 hours.
This alerting logic ensures you are not spammed with notifications, especially in cases where you have configured multiple alert types for your pipelines and some resources have their own overrides (custom alert settings) in place.
Use case
Suppose you get a Partial row failures alert for a particular Reverse ETL source. You will not get another alert for the same failure type for another 24 hours even if your data syncs are scheduled at a lesser frequency (for example, every one, five, or 12 hours).
However, if that source encounters another failure type like a fatal sync, RudderStack will trigger an alert.
Questions? We're here to help.
Join the RudderStack Slack community or email us for support
This site uses cookies to improve your experience while you navigate through the website. Out of
these
cookies, the cookies that are categorized as necessary are stored on your browser as they are as
essential
for the working of basic functionalities of the website. We also use third-party cookies that
help
us
analyze and understand how you use this website. These cookies will be stored in your browser
only
with
your
consent. You also have the option to opt-out of these cookies. But opting out of some of these
cookies
may
have an effect on your browsing experience.
Necessary
Always Enabled
Necessary cookies are absolutely essential for the website to function properly. This
category only includes cookies that ensures basic functionalities and security
features of the website. These cookies do not store any personal information.
This site uses cookies to improve your experience. If you want to
learn more about cookies and why we use them, visit our cookie
policy. We'll assume you're ok with this, but you can opt-out if you wish Cookie Settings.