Blog
Clickstream Data Mining Techniques: An Introduction
Clickstream Data Mining Techniques: An Introduction

Soumyadeb Mitra
Founder and CEO of RudderStack
12 min read
July 23, 2020
anIn this post, we cover two key algorithms for mining clickstream data – Markov Chain and the cSPADE algorithm. These techniques allow you to leverage clickstream data to understand user behavior, get a 360-degree view of your customers, and make optimizations to improve and personalize user experience. Clickstream analysis is an increasingly vital part of any big data analytics strategy.
We will focus on the two key problems that these data mining techniques solve:
- Predicting customer clicks to create data-driven customer personas, based on their behavior
- Segmenting clickstream data based on user profiles and the actions performed by these users
Note: For this post, we assume that you’ve already collected and stored your clickstream data in a data warehouse. For more information on how to collect clickstream data, refer to the Appendix at the end of this article.
What is clickstream data?
When we refer to clickstream data, we’re talking about event data, collected through a data stream in real-time, which typically represents some kind of user behavior. Clickstream data is considered a subset of Big Data. The primary data sources of clickstream data are websites and mobile applications. In this context, a clickstream is a record of all the interactions (events) performed by a user on the website or in the application.
Stitched together, this click path represents the customer journey. Clickstream metrics include things like whether the user clicked an ad, the number of pages a user visits, how many items they’ve placed in their shopping cart, and whether or not they made a purchase.
Clickstream data analysis is invaluable for digital marketing and product teams. It’s particularly valuable for e-commerce companies seeking to better understand shopper behavior and customer trends to improve the customer experience and make conversion rate optimizations.
Data Preprocessing
The clickstream data collected and stored in your data warehouse is often raw and requires refinement before it can be used for clickstream analysis.
In data science, refinement usually involves data processing, cleaning, and transforming. Once complete, the resulting dataset is ready for clickstream analytics. In our case, we will group the data into sessions.
Why it’s important to group clickstream data into sessions
A session represents a contiguous set of actions performed by a user during the course of a single visit to a site or app. It’s important to split clickstreams into these chunks of user actions, which can be used for data modeling, because it makes no logical sense to model an infinite sequence of events.
Session abstractions are used in analytical applications such as:
- Clickstream analysis
- User choice prediction
- Frequent item-set mining
The outcome of each of the above applications is strategic in nature and has the potential to drive a lot of impact. For example, they might drive important decisions such as website or mobile application layout optimizations, SKU information enhancements, or recommendation engine retraining.
Defining a Session
The definition of a session will vary between an application and a web page. In our case, we will use the following definitions:
- Application session – the time between two consecutive application start events
- Web page session – the time from the entry until the logout or timeout activity (usually 20 minutes of no activity)
Check out our sessionization repository on GitHub to see how to use the sessions in a practical scenario.
Transformation Criteria
To transform the initially collected event log into actual clickstream data, we need to:
- Identify the actions or events that are performed by an individual user and group them all together
- Split these events further into sub-groups of events, based on the events performed in the same session, as per the session definition above
Now that we have defined a session and the criteria for transforming, we need to arrange the events of each session in the appropriate time order. We can then move to the actual analysis.
The clickstream dataset we are going to use for the analysis will look like this:
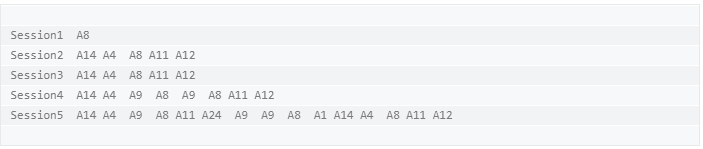
In the above dataset, each row corresponds to a session. The first column contains the session names, while the rest of the columns denote the actions (represented by A8, A14, A9, and so on) performed by the user during that particular session.
How to collect clickstream data
Download our Event Data Collection Best Practices Guide to learn all about clickstream data and how to collect it.
Constructing the model
As mentioned previously, we’ll evaluate and use two techniques to build the model in this post:
- State transitions with a Markov Model
- Discovery of sequential patterns using cSPADE algorithm
Also, the two key problems we want to solve with this model are:
User clicks prediction
In clickstream analysis, it is very useful to predict where the customers are more likely to click next, given their previously followed patterns. This insight can be used to create customer personas based on real user behavior.
Clickstream data clustering
Because of the complex nature of the websites and applications, it can be difficult to obtain similar clickstreams. Any given user can follow multiple different paths and click sequences. Thus, it can prove to be quite a task to analyze large aggregate numbers of monitored clickstreams.
An easier option in such a scenario would be to group these clickstreams based on their similarity and user profiles. This allows you to:
- Find customer segments
- Identify visitors that exhibit similar interests
Markov chains
Markov chains work best with sequential data – which is exactly what clickstream data is. Let us first quickly get an overview of the Markov process and the Markov Chain.
- The Markov process is a stochastic process satisfying the Markov property of memorylessness. Simply put – it is a random process in which the future is independent of the past, given the present.
- A Markov Chain is a Markov process that describes the sequence of possible events, in which the probability of each event is completely dependent on the state attained in the previous event.
We can graphically represent a Markov chain as a transition diagram along with the corresponding probabilities, as below:
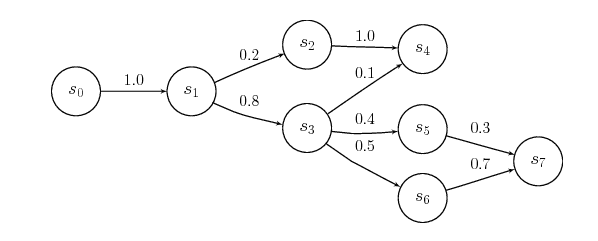
For clickstream analysis, we usually leverage the concept of Markov Chains. A process X(n) takes the state m(n) from a finite set m at a given time n.
We derive the order of the Markov chain from the number of states on which the current state of the event depends. For example, a zero-order chain implies that the probability of being in a state in the next step is completely independent of any and all the previous states.
The concept of higher-order Markov Chain leads to more realistic models. However, the number of parameters required for its representation also increases exponentially. Hence, it is extremely crucial to get the right balance here.
Fitting a markov chain
As mentioned above, our dataset looks like the following:
To construct the model, we want to use the 3rd Order Markov Chain on this dataset because:
- The number of parameters required to represent the Markov Chain are manageable
- A higher-order chain would increase the parameters required for the representation exponentially, so managing them would require significant computational resources
- We want at least half of the clickstreams to consist of as many clicks as the order of the Markov Chain that should be fitted. For example, it wouldn’t make sense to select a 3rd order Markov Chain if the majority of the clickstream consists of only 2 states because there would be no state 3 steps to take into consideration.
By fitting the Markov Chain model, we get:
- The transition probability matrix
- The lambda parameters of the chain for each one of the three lags
- The Start and End probabilities, that correspond to the probability that a clickstream will start or end with a specific event.
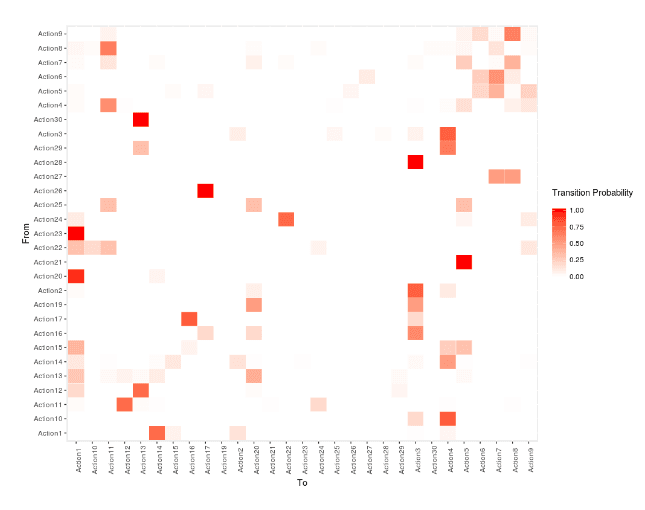
We can represent the transition probability matrix as a heat map, with Y-axis representing the current state (From) and the X-axis representing the next state (To). As you can see in the heat map below, the more reddish the color is, the higher probability there is of a given transition.
For example, the transition from Action23 to Action1 is more probable than the transition from Action21 to Action1.
Predicting customer clicks
We can determine the probability of transition, along with predicting clicks. This can be extended to the most common use case of a web page or an app. We can start from the state with the maximum start probability and follow the probable transitions – and ultimately end up with a data-driven understanding of a given customer’s transition.
Clustering the clickstream data
In our case, we will perform K-Means Clustering with 2 centers. During clustering, we notice that the average length of clickstreams varies with each cluster. This implies that the algorithm clusters the clickstreams based on the number of actions performed by the user during the given session.
We can represent the clusters graphically as below:
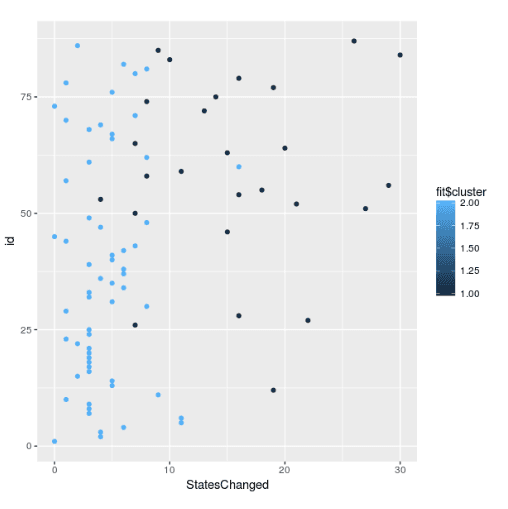
In the above graph, the Y-axis denotes a unique identifier for each session. The X-axis corresponds to the total number of states changed per session.
There are some other interesting insights in the graph. The lighter shade of blue indicates the users that perform fewer actions, and don’t spend a lot of time on the website or app.
This could imply that either they achieved their goal easily and had no problem in using the interface or navigating through the website. On the other hand, the dark blue cluster represents the users that performed multiple actions and took much more time navigating the website or the app.
It is very important to note that this interpretation can change completely, based on the data at hand. There is no thumb rule on interpreting the clusters.
It often requires deep technical as well as subject matter expertise to get the context and the interpretation of the clusters right.
Using cSPADE algorithm for mining clickstream data
An alternative approach to modeling clickstream data as transition probabilities is to represent them as sequential patterns. We can then mine them to determine trends that occur the least number of times in a given user’s clickstream data.
The SPADE algorithm can be used to explore, understand and even predict a given customer’s navigation patterns through our website or application. This algorithm takes the following approach:
- In the first step, the algorithm calculates the frequency of sequences with only one item
- In the second step, it computes the frequency of sequences with two items…. and so on.
We can use the cSPADE algorithm to extract the pattern sequences having minimum support.
As an example, if we consider our dataset – at least 40% of the clickstreams support the following 22 pattern sequences:
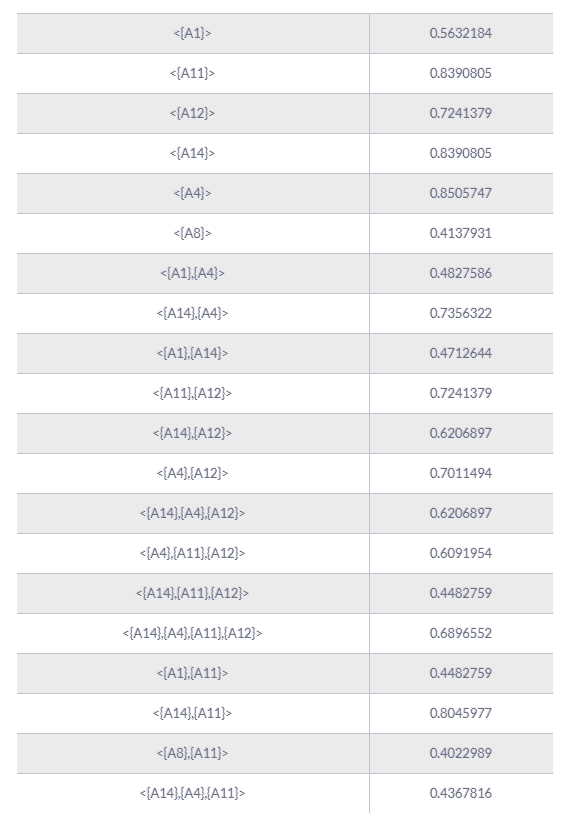
From the above table, we see that for a given sequence pattern X, it is possible to predict the next click by searching for the pattern sequence with the highest support starting with X. For example, after performing action A14, the most probable next action is A11, according to the pattern sequence 8 – with a probability of 0.8045.
It is important to note that lowering the support gives us less frequent patterns in our clickstreams. This approach is quite useful in cases where we want to extract pattern sequences that lead to errors or failures in using our product or app.
Conclusion
In this post, we explored the Markov Chain and SPADE algorithm for mining our clickstream data for data analytics. Using the model built using these techniques allows us to:
- Determine the most frequent product journeys of customers on our website or app in a very data-driven manner
- Predict the next actions of our customers/users based on their previous activities
- Extract useful sequential patterns during a session
All the relevant code pertaining to the techniques and methods used in this post can be found here.
It is worth noting that all these analyses and insights are not of much use, unless they drive some kind of action. These insights must be used as a part of a recurring reviewing process to improve product design and enhance marketing strategy.
Appendix
In this section, you can find detailed information on some of the initial tasks that need to be performed before mining your clickstream data.
Collecting clickstream data
Using clickstream data can drive powerful analyses that drive unique business value, but there’s some data engineering work that must happen first to collect and store the data for analysis. Collecting clickstream data essentially means capturing all the user activity across a web page or mobile application.
When considering “How should I capture clickstream data?” you have three options:
- Use a point solution to capture clickstream data and send it directly to the tool
- Build an integration for ingestion and set up a streaming data pipeline yourself
- Use a customer data platform or customer data infrastructure tool to capture and route your clickstream data
RudderStack’s event stream product makes it easy to capture your clickstream data with one our out-of-the-box SDK’s and route it to every destination in your stack, including your data warehouse or data lakehouse, where you can perform clickstream analytics.
How to collect clickstream data
Download our Event Data Collection Best Practices Guide to learn all about clickstream data and how to collect it.
Published:
July 23, 2020
Get started today
Start driving better business outcomes with your customer data in less than a week
Book a demo
Explore use cases with an expert and see RudderStack in action.
Implement RudderStack
Start collecting and enabling real-time customer data everywhere it's needed.
Drive better outcomes
Supercharge your analytics, product, growth, and AI teams.