Blog
JavaScript SDK from 200ms to 20ms
JavaScript SDK from 200ms to 20ms

Kostas Pardalis
Head of Developer Experience at RudderStack
8 min read
April 21, 2021

Back in 2018, Google announced that loading speed would be a factor for Google Search and Google Ads. This started a big conversation among marketeers around performance. Performance has always been important, especially in eCommerce contexts, but it became an urgent issue when Google raised the stakes.
As companies like Google and Facebook have set the standards for an instant, frictionless app and website performance, loading speed has become one of the most important factors of any internet experience. If your load time pushes past 2 seconds, users simply won’t stay long enough on your page.
Site performance can suffer for various reasons, but the issues are often related to the JavaScript that marketing teams want to run on a site. From ad pixels to trackers to CRM embeds, every unoptimized JavaScript SDK is used by marketing to get more data.
Thankfully, top companies increasingly treat site speed as an engineering issue, especially when load time translates directly to revenue.
While engineering teams might not avoid every SDK marketing wants, there are modern tools that allow engineering to provide marketing with the data they need without sacrificing performance.
This post discusses how RudderStack worked with our customer Loveholidays to develop a high-performance JavaScript SDK that reduced execution time from 200-300ms down to 20-60ms. If you’d rather watch our on-demand webinar on the subject, you can watch it here.
The Problem
One of the main factors that impact the performance of a web page is the 3rd-party libraries that are used. There are two ways that these libraries slow load times:
- Libraries have to be loaded to the browser. If the libraries have a considerable size, we will have to wait.
- Libraries perform tasks. In many cases, they have to communicate over the network to perform those tasks, which adds latency.
There are also other factors. For example, libraries might have bugs or lack optimized implementation, common issues with the lifecycle of any software product. Though understandable, bugs and slow code can literally impact revenue if a site loads too slowly.
Site Speed and the RudderStack JavaScript SDK
For products like RudderStack, things are even more complicated. Here are the two primary complexities related to performance:
Destination Integrations Impact Library Size
The RudderStack JavaScript SDK acts like middleware between our customer’s website and the many different destinations where they send the data. Destination needs vary by customer, so the final size of the library can change considerably.
Variations in User-Defined JSON Payloads
Another reason for additional performance complexity is the payload that the RudderStack Javascript SDK has to deliver.
Specifically, RudderStack users define arbitrary JSON documents sent over the network when a specific change on the DOM is detected. As the DOM is affected by user actions, some metadata is captured and included in the payload. The library then makes sure that the JSON documents are delivered in the right order to the server.
Towards a Solution
Because of the above two conditions, it’s very hard to offer a consistent experience across all library uses or reason about performance before the SDK is deployed in production.
We had been working for some time on improving the performance of our JavaScript SDK, especially because we serve multiple enterprise e-commerce companies, but had the privilege of working with David Annez at Loveholidays to finalize and test the high-performance library.
Here’s how we did it.
Improving the Performance of JavaScript SDK
The two problems we mentioned earlier require different tactics for improving speed. We will start by first explaining what we did to handle the arbitrary size of the used library.
Reducing the Size of the Library
On its own, the initial size of the JavaScript SDK is small. The problems start when native destinations need to be supported.
A native destination is any destination where the data is directly pushed into it, instead of sending the data to the RudderStack data plane and route it to the application. For example, many of our customers run the Google Analytics, Hotjar, and Firebase SDKs natively through the RudderStack JavaScript SDK. One of the main reasons for this is performance, but there are cases where the destination doesn’t offer a publicly available API. In any case, it is a necessity.
Fetching native libraries inevitably adds to the latency; however, the main problem is that as we support more of these libraries, more instrumentation is added to the RudderStack JavaScript SDK and its size increases.
Solution: Only Loading What you Need
The high-level solution here was quite simple, thanks in large part to some good thinking by David and his team.
At a basic level, the high-performance JavaScript SDK doesn’t bundle the instrumentation code for end destinations in the core SDK. Instead, the SDK only fetches the destination configuration settings from the RudderStack dashboard (such as track ID, API key, secret, etc.) using the requireIntegration_ method.
Let’s look at a quick example to see how this works in practice.
Once the JavaScript SDK receives a call such as rudderanalytics.requireIntegration("GA"), it automatically fetches the Google Analytics instrumentation code (such as GAPlugin.js) that handles the transformation and mapping logic for the RudderStack event payload. This includes the call type and the API calls.
The core SDK maintains a queue for all the calls. When a requireIntegration call happens, any related calls are queued, and the SDK starts fetching the necessary library. When this is done, the queue will start executing the enqueued calls.
By this strategy accomplishes the following:
- Any native libraries are fetched to the client only when required (or, said another way, only if a call happens that requires the library).
- Simultaneously, any subsequent calls are queued, so there’s no blocking on the client and thus no added performance penalty.
- This strategy allows the JavaScript library to maintain a minimal size and ensure that the speed penalty to the first load of a page will be as minimal as possible.
By implementing the above and removing unnecessary integration snippets, load times for Loveholidays decreased almost 10x than their previous solution (Segment’s analytics.js).
Controlled tests clocked load times between 20-60ms, down from 200-300ms.
XHR vs. sendBeacon or Sync vs. Async
To further improve the performance of our SDK, we decided to experiment with sendBeacon.
The Beacon API is used to send a small amount of data asynchronously to a web server. The main reason it was introduced was for analytics use cases, which perfectly fits many of our performance-conscious eCommerce customers.
The most important aspect, though, is Beacon’s asynchronous nature. We assumed that by using sendBeacon, we could reduce the input delay even further.
The Details: Beacon vs. XHR
Running synchronous XHR calls for tracking can impact the first input delay (FID) of the page, slowing down the responsiveness when measured by tools like a lighthouse.
We worked with David and the Loveholidays team to A/B test Beacon vs. XHR for the RudderSTack SDK. Spoiler alert: it worked. We saw the average FID drop from 200 to 20ms using Beacon. Much of the reasoning for this was the offloading to batch + async calls supported by the new RudderStack SDK.
This is an actual chart from the Loveholidays test:
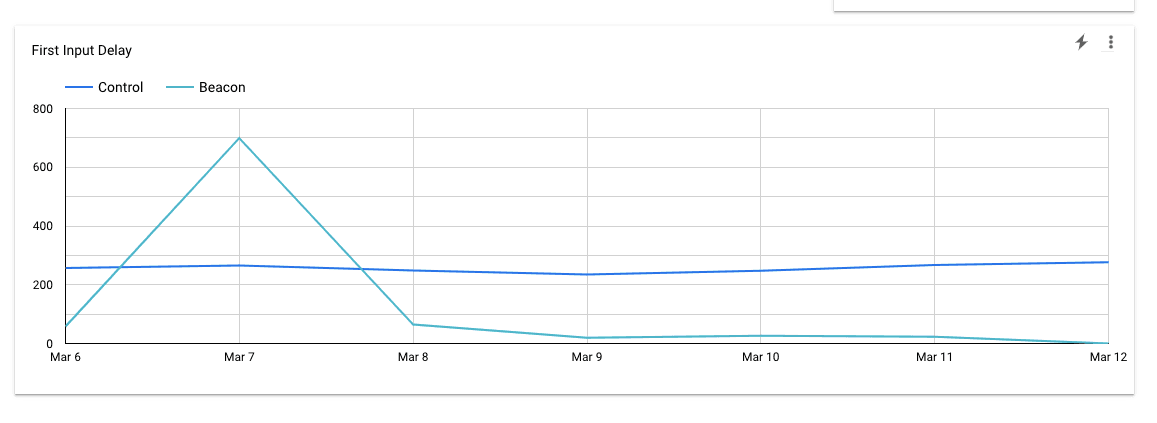
Actual Chart from the Loveholidays Test
While sending data asynchronously via Beacon might not be right for every company, it can drive material improvement for high performance-sensitive use cases.
Conclusion
At RudderStack, our mission is to build the most performant customer data pipelines possible. We understand that whatever we do with our SDKs will affect the experience the end-user has, and for this reason, we take performance extremely seriously.
The above changes we performed on our Javascript SDK allowed us to reduce the execution time of the SDK from 200+ ms to 20-60ms, which is not only a huge improvement but standard-setting when compared with other vendors in the space.
Of course, as engineers, there are still many things we are exploring to improve performance even further. One of our next experiments will be implementing the Beacon API together with a queue.
Performance is fascinating and increasingly critical, so stay tuned for updates from the engineering team on how we’re ensuring our SDKs are as optimized as possible.
Sign up for Free and Start Sending Data
Test out our event stream, ELT, and reverse-ETL pipelines. Use our HTTP source to send data in less than 5 minutes, or install one of our 12 SDKs in your website or app. Get started.
Published:
April 21, 2021


Get started today
Start driving better business outcomes with your customer data in less than a week
Book a demo
Explore use cases with an expert and see RudderStack in action.
Implement RudderStack
Start collecting and enabling real-time customer data everywhere it's needed.
Drive better outcomes
Supercharge your analytics, product, growth, and AI teams.