Data Analytics Lifecycle
The data analytics lifecycle is a six-phase framework for conducting data analytics with business objectives at its core. Derived from the CRISP-DM process model developed by IBM, it guides data teams from problem identification through model operationalization, covering data collection, preparation, model selection, execution, and stakeholder communication. This article covers what the data analytics lifecycle is, why it matters, and what each of the six phases involves.
Key concepts
- Discovery: The first phase, in which teams define the business objective, identify relevant data sources, perform a gap analysis, and formulate the hypothesis that will guide the analysis.
- Data preparation: The process of collecting data from source systems, loading it into an analytics sandbox, and applying preprocessing and analytics transformations, such as removing nulls and standardizing field formats, before modeling begins.
- Model planning: The selection of the appropriate analytical model, whether SQL, statistical, or machine learning, based on dataset size, structure, and the form of the expected output.
- Model building and execution: The phase in which the chosen model is constructed, trained where required, and run against the dataset to generate results that can be tested and compared against the initial hypothesis.
- Communicating results: The step in which findings are presented to stakeholders through data visualizations and narrative explanation, including an assessment of confidence based on the original hypothesis criteria.
- Operationalizing: The final phase, in which a validated model runs on a production dataset, results are monitored against the business objective, and final reports are delivered to stakeholders.
What is the data analytics lifecycle?
The data analytics lifecycle is a series of six phases that have been identified as vital for businesses doing data analytics. It is based on the CRISP-DM analytics process model, an open-standard model developed by IBM, and runs from identifying the problem to be solved, through running chosen models against sandboxed data, to operationalizing model output on a production dataset.
Following this lifecycle enables data teams to find answers to their initial business questions and use those answers to inform decisions across the organization.
Why does the data analytics lifecycle matter?
The data analytics lifecycle allows businesses to better understand the factors that affect successes and failures in their operations. It is especially useful for finding out why customers behave in a certain way, producing insights that can directly inform growth strategy.
Each phase in the lifecycle is integral to an effective analysis. A well-formed hypothesis gives the study clarity and direction. Clean, prepared data ensures models have reliable inputs to work with. Careful model planning increases the likelihood of selecting an approach that actually fits the problem. And structured communication of results ensures stakeholders can act on findings promptly rather than waiting for interpretation.
Following all six phases also gives data teams a clear basis for deciding when to move forward, when to revisit a phase, and when to restart the process entirely. Without this structure, analytics work can become directionless, producing outputs that are technically correct but organizationally useless.
What are the phases of the data analytics lifecycle?
Each phase in the data analytics lifecycle is influenced by the outcome of the preceding phase. It generally makes sense to perform them in order, though teams can revisit earlier phases when a later step surfaces gaps in the data or the hypothesis.
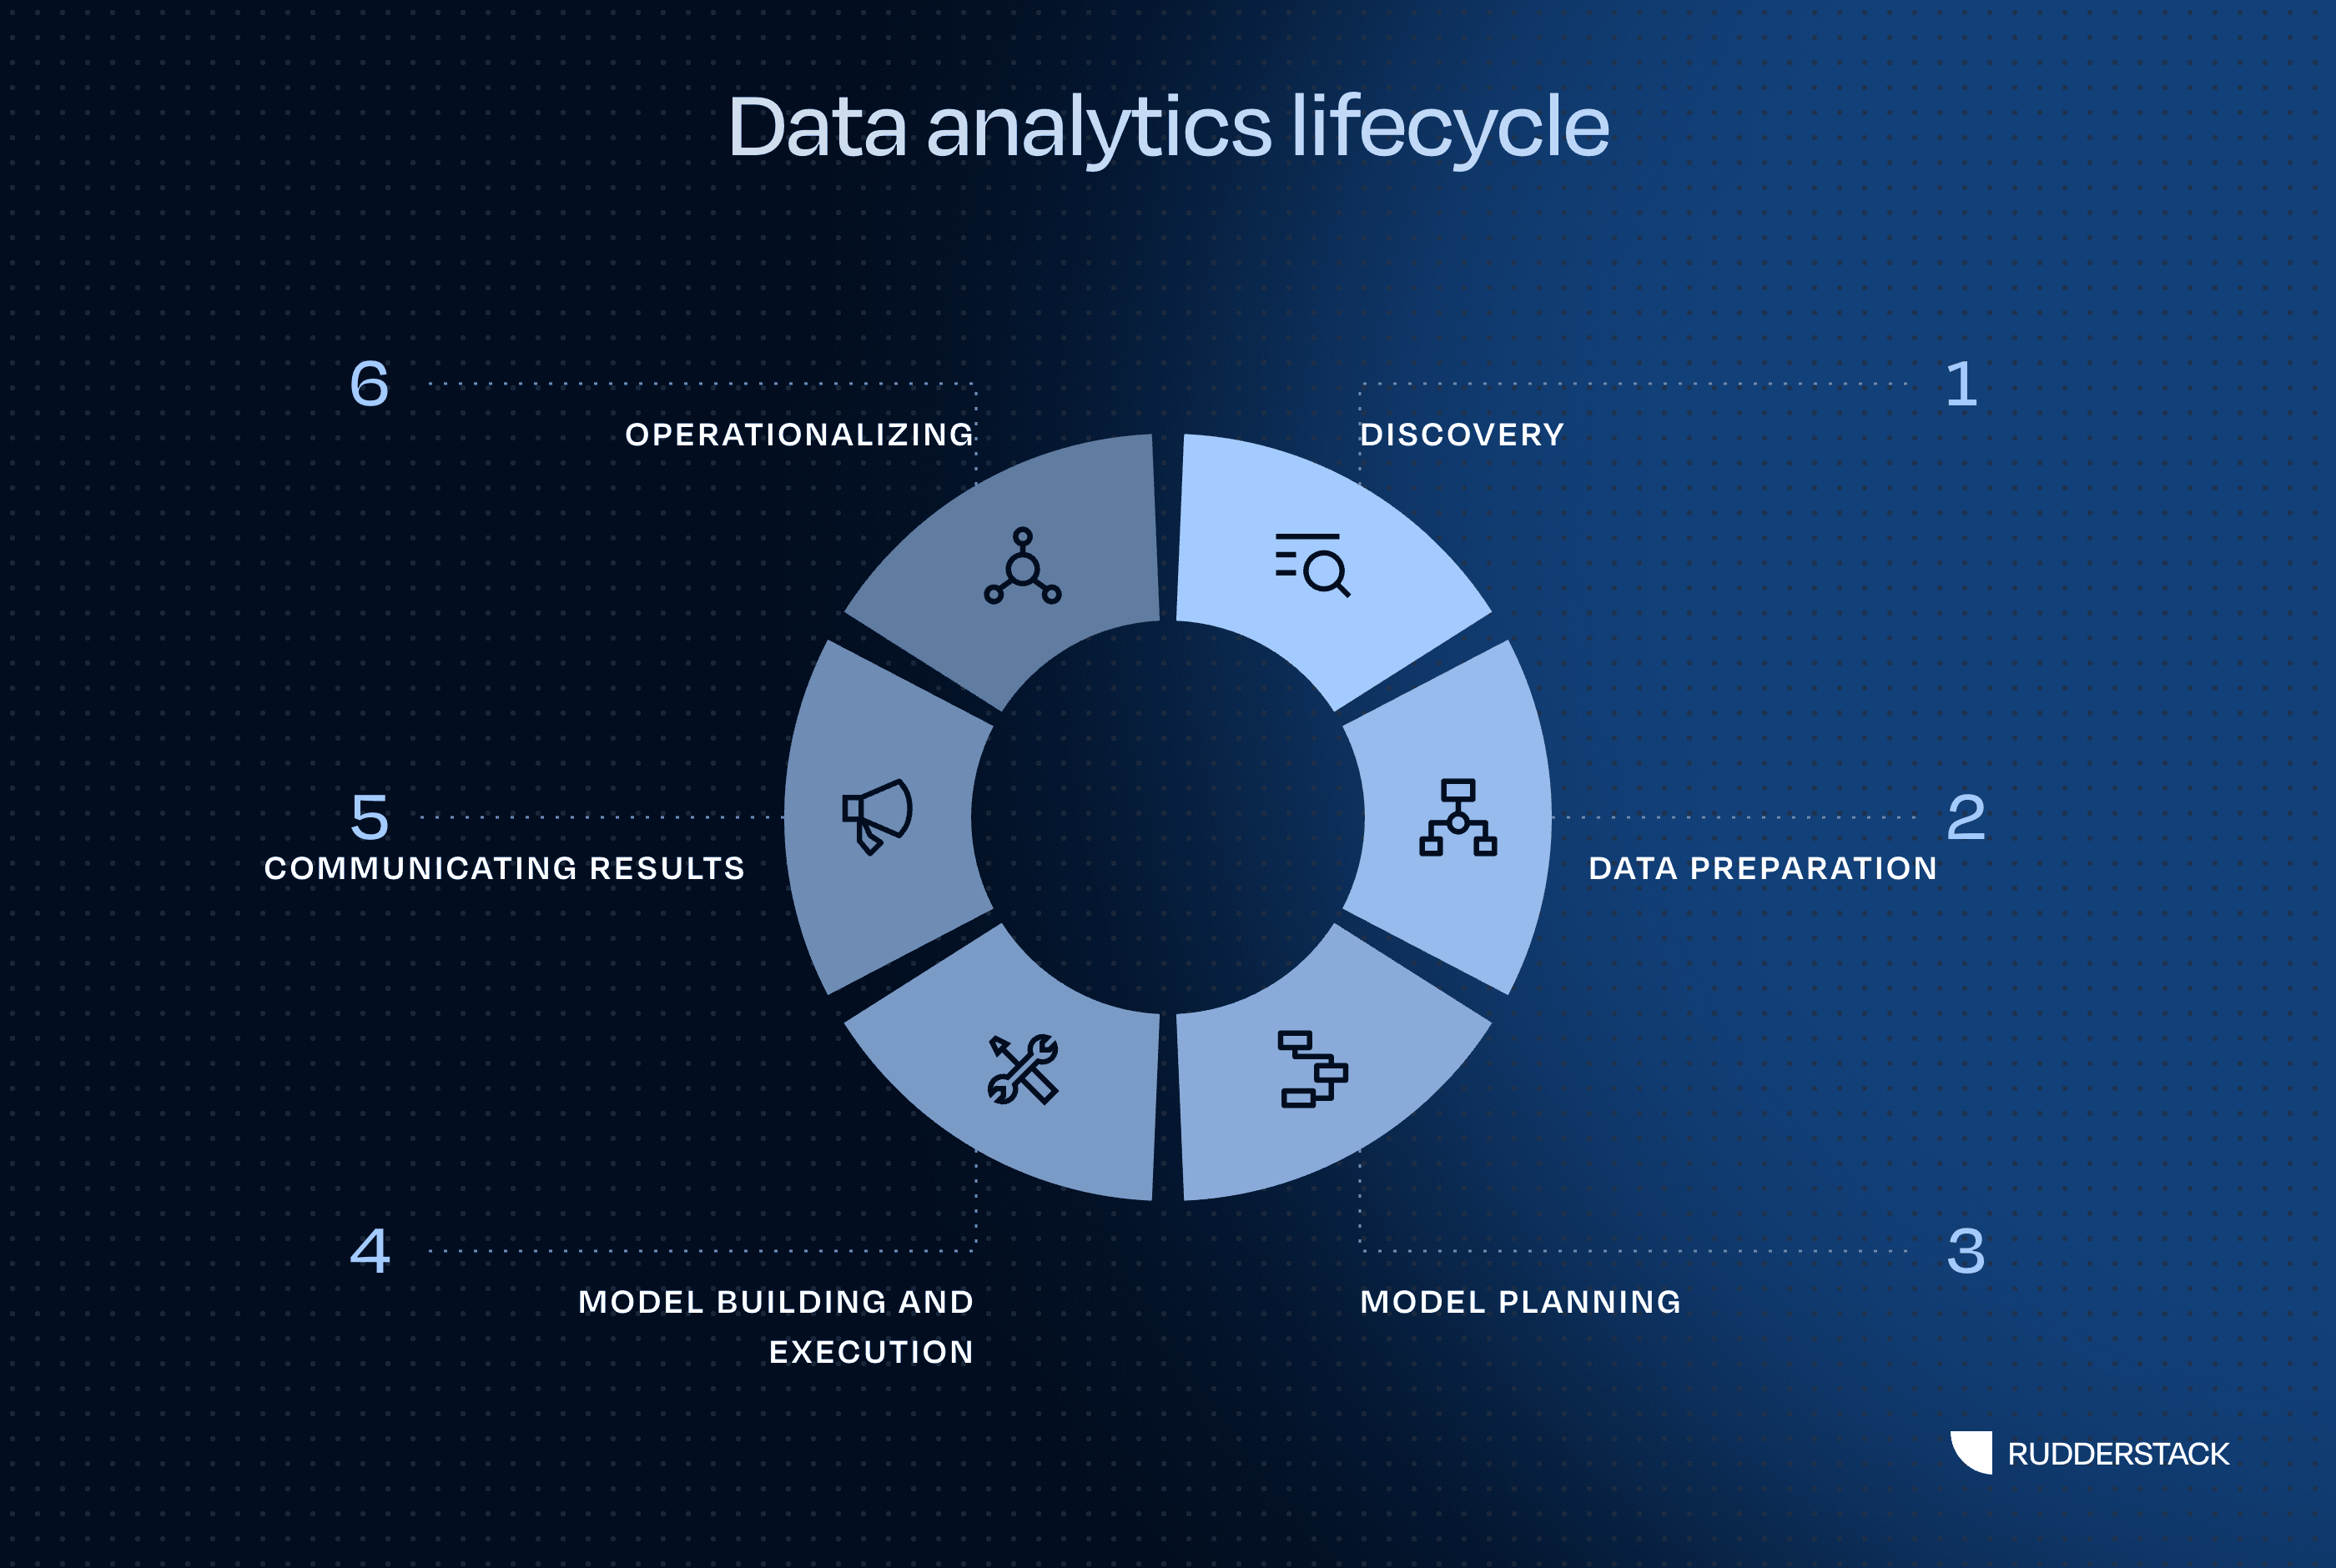
The six phases of the data analytics lifecycle, from discovery through operationalizing.
The six phases of the data analytics lifecycle
- Discovery: Define the business objective, identify data sources, and formulate a hypothesis.
- Data preparation: Collect, clean, and transform data into an analytics sandbox.
- Model planning: Select the appropriate model based on the dataset and the business question.
- Model building and execution: Build and run the model; test results against the hypothesis.
- Communicating results: Share findings with stakeholders using visualizations and narrative context.
- Operationalizing: Run the validated model on production data and monitor for goal achievement.
Phase 1: Discovery
The discovery phase involves establishing context around the problem to be solved. Teams begin by defining the business objective and the scope of the work, then identify which data sources will be available and useful — for example, Google Analytics, Salesforce, a customer support ticketing system, or marketing campaign data.
From there, teams conduct a gap analysis to compare the data required to solve the problem against the data currently available, and develop a plan to acquire anything missing.
Once the objective is defined, the next step is to formulate an initial hypothesis. The analysis should be designed to either accept or reject this hypothesis, and the criteria for doing so should be decided in advance. This ensures the analysis follows a rigorous, scientific method rather than drifting toward a predetermined conclusion.
Phase 2: Data preparation
In the data preparation phase, teams decide which data sources are relevant, collect data from those sources, and load it into an analytics sandbox for prototyping. Before or after loading, the data must be transformed.
There are two main categories of transformations. Preprocessing transformations clean the data by removing nulls, defective values, duplicates, and outliers. Analytics transformations make the data more useful for analysis, such as standardizing or normalizing values for use with machine learning algorithms, or converting machine-readable labels into human-readable ones.
Depending on whether transformations happen before or after the load step, this process is known as ETL (extract, transform, load) or ELT (extract, load, transform). Teams can build their own pipeline to handle this or use an integrated customer data platform to manage the process within a unified environment.
It is also worth noting that the sub-steps in this phase do not require separate systems. If all data sources are already in a data warehouse, teams can use a development schema within that same warehouse for exploratory analysis and transformation work.
Phase 3: Model planning
A model in data analytics is a mathematical or programmatic description of the relationship between two or more variables. It allows teams to study how different variables affect their data and make statistical assumptions about the probability of a given outcome.
The three main categories of models are SQL models, statistical models, and machine learning models. A SQL model can be as simple as the output of a SELECT statement and is often used for business intelligence dashboards. A statistical model describes the relationship between one or more variables, a capability some data warehouses incorporate into their SQL processing. A machine learning model uses algorithms to recognize patterns in data and must be trained on existing data before use. These models are typically the right choice when there is not enough prior information to solve the problem through simpler approaches.
When selecting a model, teams should work through the following considerations:
- Dataset size: More complex neural networks with many hidden layers require larger training datasets to produce accurate approximations. Smaller datasets, or use cases that require fast dashboard performance, may call for simpler, pre-aggregated models.
- How the output will be used: If end users will perform additional aggregations or drill-downs in a BI tool, the prepared dataset must support that. Averaging an already-averaged metric is a common and easy-to-miss pitfall.
- Whether the data is labeled: Labeled data with column headings supports supervised learning. Unlabeled data requires unsupervised learning.
- Whether the expected output is qualitative or quantitative: Quantitative questions, such as how many sales are forecast for next month, call for regression models. Qualitative questions, such as which product is most likely to appeal to a given customer segment, call for classification or clustering models.
- Accuracy and speed requirements: Some models trade accuracy for speed or vice versa. Dataset size is a key factor in evaluating this tradeoff for a given use case.
- Whether the data is unstructured: Unstructured data, such as emails or free text files, cannot be easily stored in relational databases and is best suited to machine learning approaches.
- Dataset contents: Univariate or multivariate analysis, such as factor analysis or principal component analysis, can reveal which variables have the largest effects and surface new composite factors worth including in the model.
Phase 4: Building and executing the model
Once the appropriate model is selected, teams build it and begin drawing inferences from the modeled data. The specific steps depend on the type of model chosen.
SQL model
The first step is to identify the relevant source tables and join keys, then decide where to build the model. Depending on complexity, this can range from saving SQL queries in a data warehouse and scheduling automatic execution, to building more complex modeling chains using tools such as dbt or Dataform. In the latter case, the recommended approach is to create a base model first, then extend it with a second model so the base can be reused for future work. Once the extended model is tested and verified, it is published to its destination, such as a business intelligence or reverse ETL tool.
Statistical model
The first step is to develop a dataset containing exactly the information required for the analysis and no more. From there, teams select the appropriate statistical approach, such as a correlation test, a linear regression model, or an analysis of variance (ANOVA), then run it against the dataset and publish the results.
Machine learning model
Machine learning model development begins the same way as statistical modeling: by constructing a focused dataset. However, machine learning models require that dataset to be split into two samples, one for training and one for testing.
There will often be several strong candidate models for a given dataset, such as linear regression, decision trees, or support vector machines. Testing multiple candidates to identify which performs best is a common and worthwhile approach. Once a model is selected, it is trained on the training dataset with parameters tuned for optimal predictive performance. The model is then run on the test dataset, and the most accurate result is used to generate the final output for publication.
Phase 5: Communicating results
After models are built and results are generated, findings must be communicated clearly to stakeholders. Data visualizations are a useful tool for making results accessible, particularly when the underlying data is complex or the audience is non-technical.
Any communication with stakeholders should include a narrative, a summary of key findings, and an explanation of the value the analysis adds to the business. It should also compare the model's output against the criteria established in the discovery phase for accepting or rejecting the initial hypothesis. This allows stakeholders to understand how much confidence to place in the analysis and what actions are warranted.
Phase 6: Operationalizing
Once stakeholders have reviewed and accepted the analysis, the validated model is run outside the analytics sandbox on a production dataset. Teams monitor the results to confirm they are achieving the original business objective. If objectives are being met, final reports are delivered to stakeholders and communicated more broadly across the business.
Summary
The data analytics lifecycle structures analytics work into six sequential phases: from defining a business objective and preparing data, through selecting and running an appropriate model, to communicating results and deploying to production. Following all six phases reduces the risk of incomplete or misdirected analysis and ensures findings reach stakeholders in a form they can act on.
Further reading
For more on data analytics, the RudderStack learning center covers related topics, including:
FAQs
The data analytics lifecycle is a six-phase framework for conducting data analytics projects. It is based on the CRISP-DM process model and covers discovery, data preparation, model planning, model building and execution, communicating results, and operationalizing. Each phase builds on the outcome of the one before it, guiding data teams from problem definition through production deployment.
The six phases are: (1) Discovery, (2) Data preparation, (3) Model planning, (4) Building and executing the model, (5) Communicating results, and (6) Operationalizing.
The lifecycle is designed to be followed sequentially, since each phase informs the next. Teams can revisit earlier phases if the outcome of a later phase reveals gaps — for example, returning to data preparation after model planning reveals a missing variable. Skipping phases is not recommended, as doing so tends to reduce the reliability and usefulness of the analysis.
Both ETL (extract, transform, load) and ELT (extract, load, transform) describe how data is prepared during the data preparation phase. In ETL, data is cleaned and transformed before being loaded into the analytics sandbox. In ELT, raw data is loaded first, then transformed within the destination environment. The preferred approach depends on the available infrastructure and tooling.
The three main categories are SQL models, statistical models, and machine learning models. SQL models are commonly used for business intelligence dashboards. Statistical models describe relationships between variables. Machine learning models identify patterns in data and require training data. The right model depends on the dataset size, whether the data is labeled, and whether the expected output is quantitative or qualitative.
Supervised learning is used when the dataset includes labeled column headings, allowing the model to train on known examples. Unsupervised learning is used when data lacks labels and the model must find structure on its own. The choice is made during the model planning phase based on what data is available.
Each phase serves a distinct purpose that the others depend on. Without a well-defined hypothesis from discovery, modeling lacks direction. Without clean, prepared data, models produce unreliable results. Without stakeholder communication, insights do not get acted on. Skipping any phase increases the risk of producing analysis that does not serve the original business objective.
In the operationalizing phase, the validated model is run on a production dataset rather than the analytics sandbox. Results are monitored to confirm the business objective is being met. If it is, final reports are delivered to stakeholders and communicated more broadly across the business.
Can't find what you're looking for? Give us a shout!
