Blog
Using Grafana to Monitor the Health and Status of Your Customer Data Pipelines
Using Grafana to Monitor the Health and Status of Your Customer Data Pipelines

Sumanth Puram
Head of Engineering at RudderStack
6 min read
April 12, 2021

RudderStack processes billions of data points for all kinds of companies every day. That data populates destinations across our customers’ stacks, from marketing and product data to warehouse and data science infrastructure.
The system itself, though, also produces some interesting data. Because customer data pipelines are core to the way business is done today, we built RudderStack with the ability to observe and configure at its core.
We use metrics and logs ourselves to understand what’s going on inside the system, but we also provide the same rich observability to our customers. Engineers using RudderStack can use the same tooling to quickly find the root cause of issues, identify bottlenecks, and spot misconfigurations.
Most importantly, we’ve focused on enabling system health observability in a way that integrates with tools our customers already use, like Grafana for dashboarding and PagerDuty for alerting.
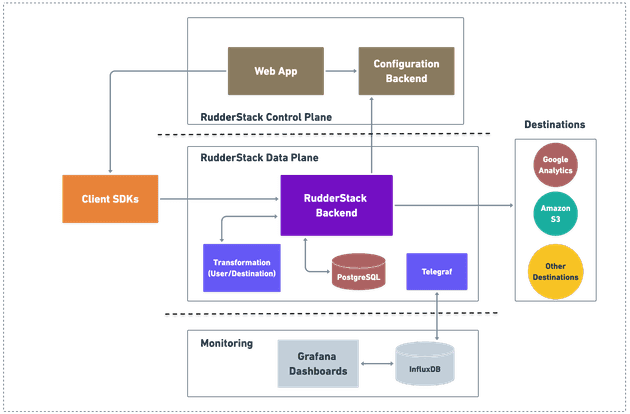
Here’s a high-level visualization of RudderStack’s architecture. Below, we dig into the specific metrics and logs produced by the system and how we (and our customers) use them.
Metrics
The RudderStack data plane generates 275+ different metrics. A majority can be categorized into one of these buckets. These matrices are ordered in the same sequence as data that flows through the platform):
- Ingestion metrics: request volume, request latencies, request size
- User Transformation metrics: Time taken for isolate-vm creation, time taken for executing functions, input request size for transformations
- Queue (JobsDB) metrics: RudderStack uses PostgreSQL as queue before sending them to destinations and generates the following metrics: Queue size, time taken to query the queue, queue processing throughput
- Destination metrics: Events delivered to destinations, response codes returned by destination, delay in delivering to destinations, number of failed events
- Warehouse metrics: Number of tables synced, schema updates to the table, time taken to sync to the warehouse, number of files and their sizes that are loaded into the warehouse, events rejected because of incompatible schema
- Runtime metrics: Golang's garbage collection metrics, heap and stack memory metrics, number of goroutines, etc.
Metrics tooling
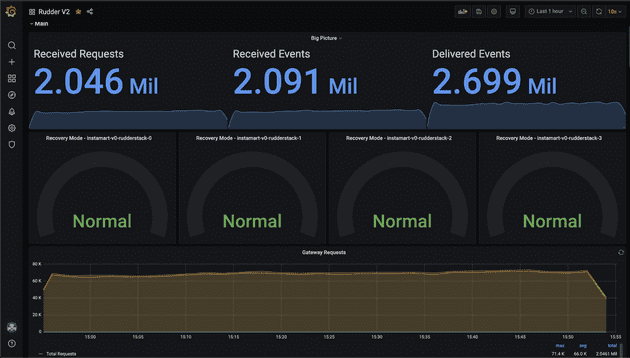
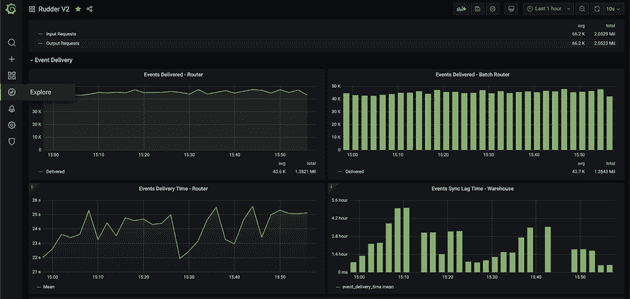
RudderStack uses Telegraf to collect metrics, InfluxDB for storing, and Kapacitor for alerting. We use Grafana for plotting all the metrics and group them by sources and destinations to provide easier insights.
Metrics overview
Event delivery
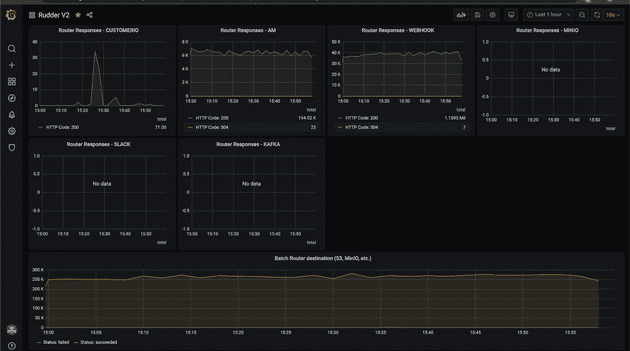
Router responses
RudderStack system metrics in action
Our customers use RudderStack pipelines to trigger time-critical actions. For example, they might trigger verification emails to users resetting passwords or send a push notification for a timeline deal to a mobile app user. Any delay or malfunction in these flows creates a bad user experience.
Not only do our customers use system reporting to track the time taken to deliver these critical events, but they also set up custom alerts based on the destination type. For example, one of our customer’s pipes data into Braze to trigger push notifications and fires alerts if the delay exceeds 1 minute.
Many of our customers also monitor warehouse loads. Though less time-sensitive, they are equally critical for analytics, enrichment, and data science use cases. Being alerted when loads fail due to incompatible schemas allows them to fix the problems quickly so that downstream processes aren’t interrupted.
Here are some of the most common alerting use cases across our customers:
- Delivery time to critical destinations
- Time to run User Transformations
- Events aborted
- Event volume spikes (past a defined threshold)
- Rows synced to the warehouse (and any related errors)
To make things even easier, we’ve built out 30+ pre-configured alerts, which can be linked to systems like PagerDuty, OpsGenie, or any HTTP endpoint.
Our enterprise offering has 30+ pre-configured alerts, and these can be linked to your alerting systems, such as PagerDuty, OpsGenie, or any HTTP endpoint.
To dig deeper into RudderStack Grafana dashboards, check out the docs.
Logs
Metrics help you understand patterns over time, but logs enable you to debug and narrow down specific issues. Specifically, you can follow logs to understand what happened to data at different stages as it flowed through the system.
To help with triage, each log message has a corresponding log level that implies the importance and urgency of the message.
Maintaining the value of logs at scale
While helpful, logs can become hard to derive value from at scale. When you send multiple thousands of events per second, making sense of every state transition of every data point is impractical.
To help our customers leverage the value of logs at scale, RudderStack logs all INFO, ERROR, and FATAL levels by default. The system also has a logger for every module whose logging level can be updated at runtime without restarting services. This enables our customers to set DEBUG logs for specific modules, giving them the right amount of problem-solving information.
Also, RudderStack’s rudder-server Docker image has a pre-installed CLI tool that can invoke RPC and update any module’s logging configuration.
Log tooling
RudderStack uses fluentd in our open-source Kubernetes deployment with which you can route all the logs to your internal log aggregators like ElasticSearch, MongoDB, etc.
Our goal is best-in-class, configurable system health reporting
As I mentioned above, we want to make it easy for our customers to achieve best-in-class system health reporting. Instead of spending engineering cycles on custom dashboards, we meet data engineers and developers where they already are by providing reporting through tools like Grafana.
We’re learning more from our customers every day about their various needs. We will continue to improve the usefulness and ease of configuration so that RudderStack users can spot and solve any possible issue related to mission-critical customer data.
Get started with RudderStack & Grafana
Sign up for RudderStack today, and watch this tutorial to learn how to get started with Grafana, set up alerts, and distribute your alerts into downstream tools.
Published:
April 12, 2021
More blog posts
Explore all blog posts
How to improve data quality: 10 best practices for 2026
Danika Rockett
by Danika Rockett

AI is a stress test: How the modern data stack breaks under pressure
Brooks Patterson
by Brooks Patterson

Generative AI risks and how to approach LLM risk management
Danika Rockett
by Danika Rockett


Start delivering business value faster
Implement RudderStack and start driving measurable business results in less than 90 days.


